Double-Digit Gains in the US and Developed Markets but a Drag in Emerging Markets and Fixed Income
Returns since inception to 2021
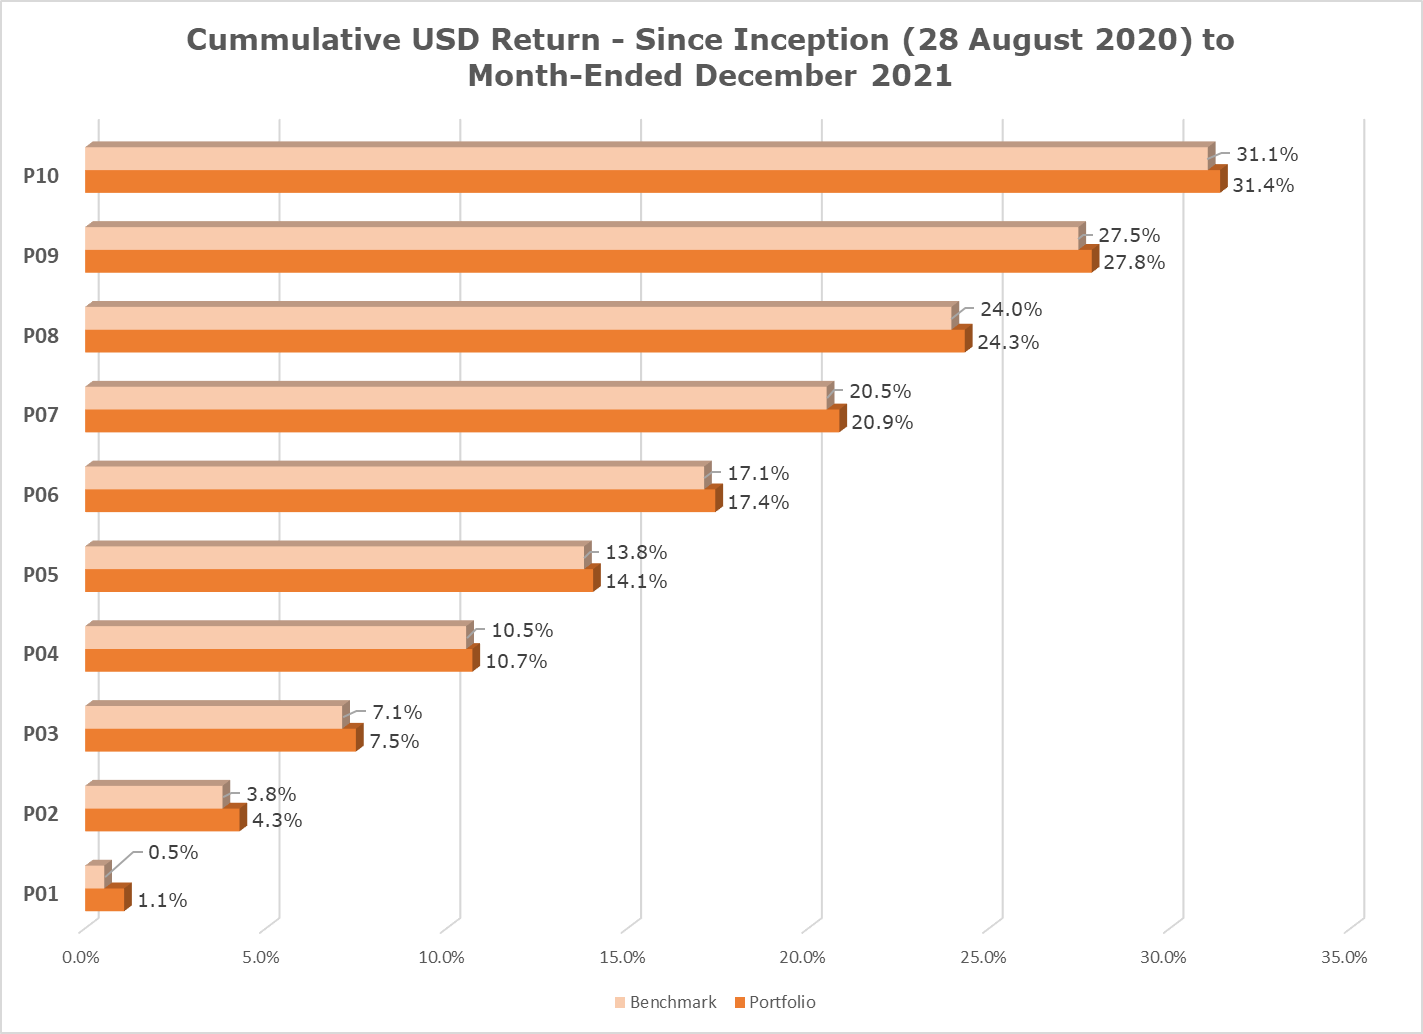

Source: Morningstar
Since inception, P04-P010 tracked closely their respective benchmarks. The positive tracking differences were generally attributable to the 11-19 bps premium of Developed Markets ex-US, Emerging Markets and Global Fixed Income ETFs relative to their respective Net Asset Values and a cash distribution from Developed Market ex-US at the year-end 2021. The positive tracking differences in P01-P03 were due to the outperformance of the fixed income mutual funds relative to its benchmark.


Source: Morningstar
The annualised returns continued to track underlying benchmarks closely except for P01-P03, which outperformed benchmarks meaningfully.


Source: Morningstar


Source: Morningstar
Full year 2021 returns

In 2021, the US stock market outpaced the most major stock markets. The UK, Germany and Japan posted gains but lagged the US. Emerging markets significantly underperformed both US and developed markets, mainly dragged by decline in Chinese stocks although India performed very well. China was hit by the debt crisis in property giant Evergrande and a regulatory crackdown in the tech and education sectors. India benefited from a government bond-buying program and a potential stimulus in infrastructure and healthcare.
US equity finished 2021 near record highs, having posted the third successive year of double-digit gains thanks to economic recovery from the COVID-19 pandemic. Surging inflation was however bad news for fixed income assets, leading key bond market indices to post their first yearly losses since 2013. Only high-yield and inflation-protected bonds ended 2021 in positive territory among the major bond indices.
As far as currency effects are concerned, the Ringgit’s weakness against the USD added another 4.06% returns to the portfolios in 2021.
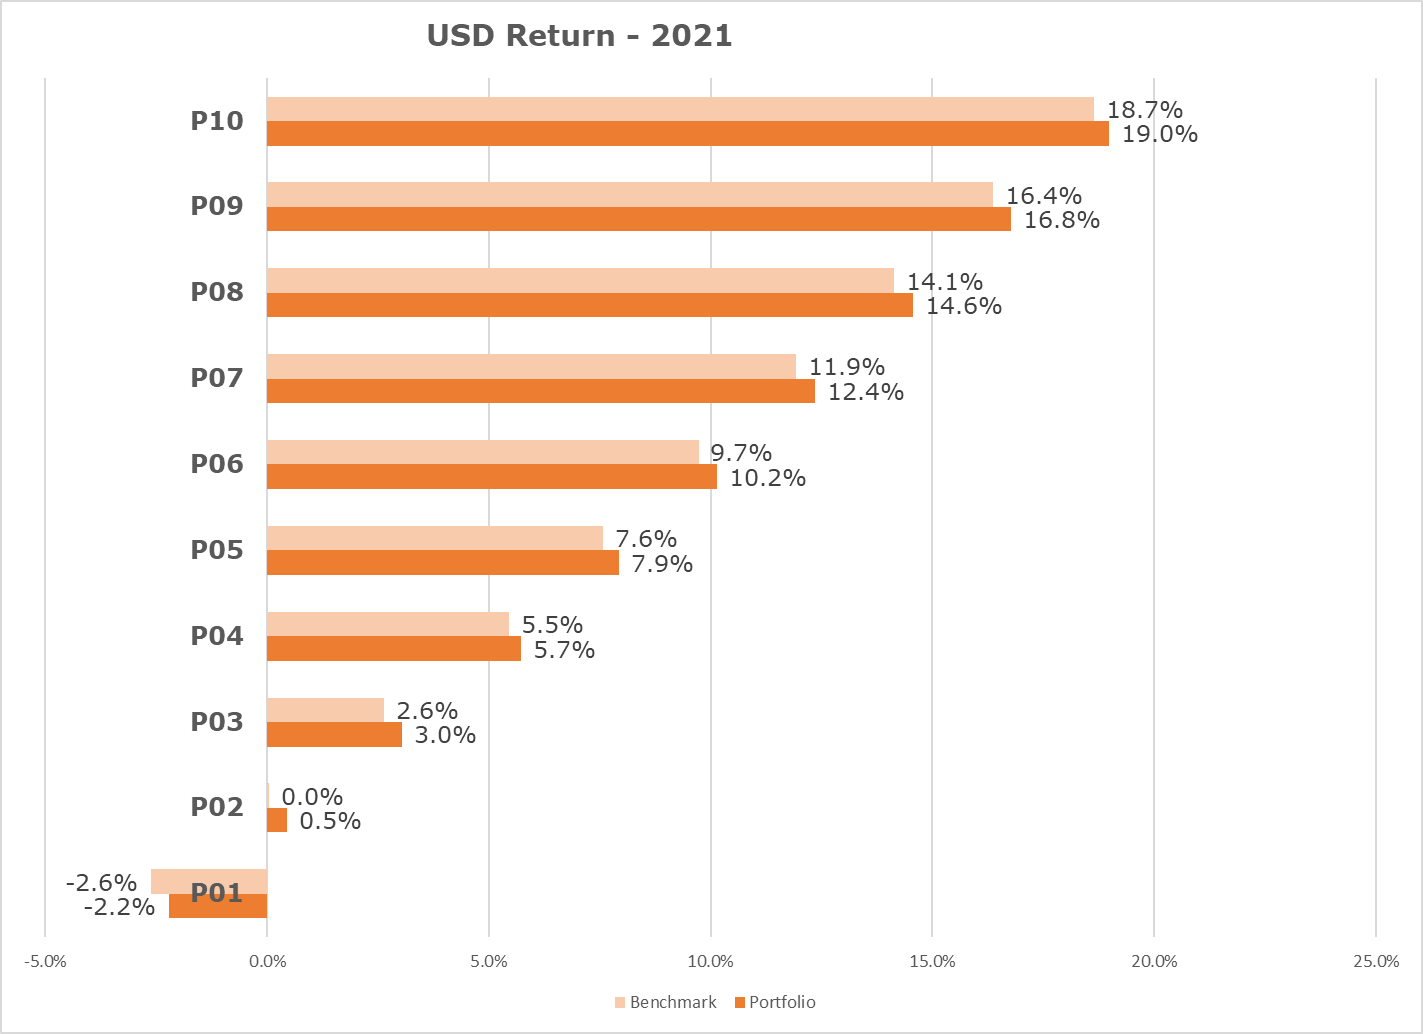

Source: Morningstar
For full-year 2021, P04 and P10 tracked closely to their respective benchmark, which was attributable to 3-35bps premium of Developed Market ex-US, Emerging Market and Global Fixed Income ETFs relative to their respective Net Asset Values The tracking differences in P01-P03 were attributable to the outperformance of the fixed income mutual funds relative to its benchmark and RM depreciation.


Source: Morningstar
Benchmarks
We use market indices that mimic how the underlying ETFs and mutual funds perform to construct the blended benchmark, which comprises the following and according to each portfolio’s respective asset allocation.
| Asset Class | Benchmark |
|---|---|
| Developed Market Equities Large Cap (ex-US) | MSCI EAFE |
| US Equity Large Cap Blend | S&P 500 |
| Emerging Market Equities | MSCI Emerging Market |
| Global Fixed Income | Bloomberg Barclay Global Aggregate Ex USD Float Adjusted |
| US Fixed Income | Bloomberg Barclay US Aggregate Float Adjusted |
| Malaysia Fixed Income | Markit iBoxx ALBI Malaysia |

Disclosures
Past data and performance do not indicate future performance. Actual individual investor performance will vary depending on the initial investment, amount and frequency of contributions, allocation changes, taxes and fees during the time frame considered.

